Last time in “Web Performance Explained”, we explored the role of good web performance when it comes to increasing your website’s conversions and boosting its search engine optimisation (SEO).
We learned the faster your website, the higher search engines such as Google will rank it - meaning more users. We also learned that the faster your website, the better the user experience, meaning the likelihood of users converting into customers and generating additional revenue for the business is increased.
Moving on, we’re covering a more practical topic for the latest “Web Performance Explained”. What do you measure to capture your website’s performance?
Measuring web performance
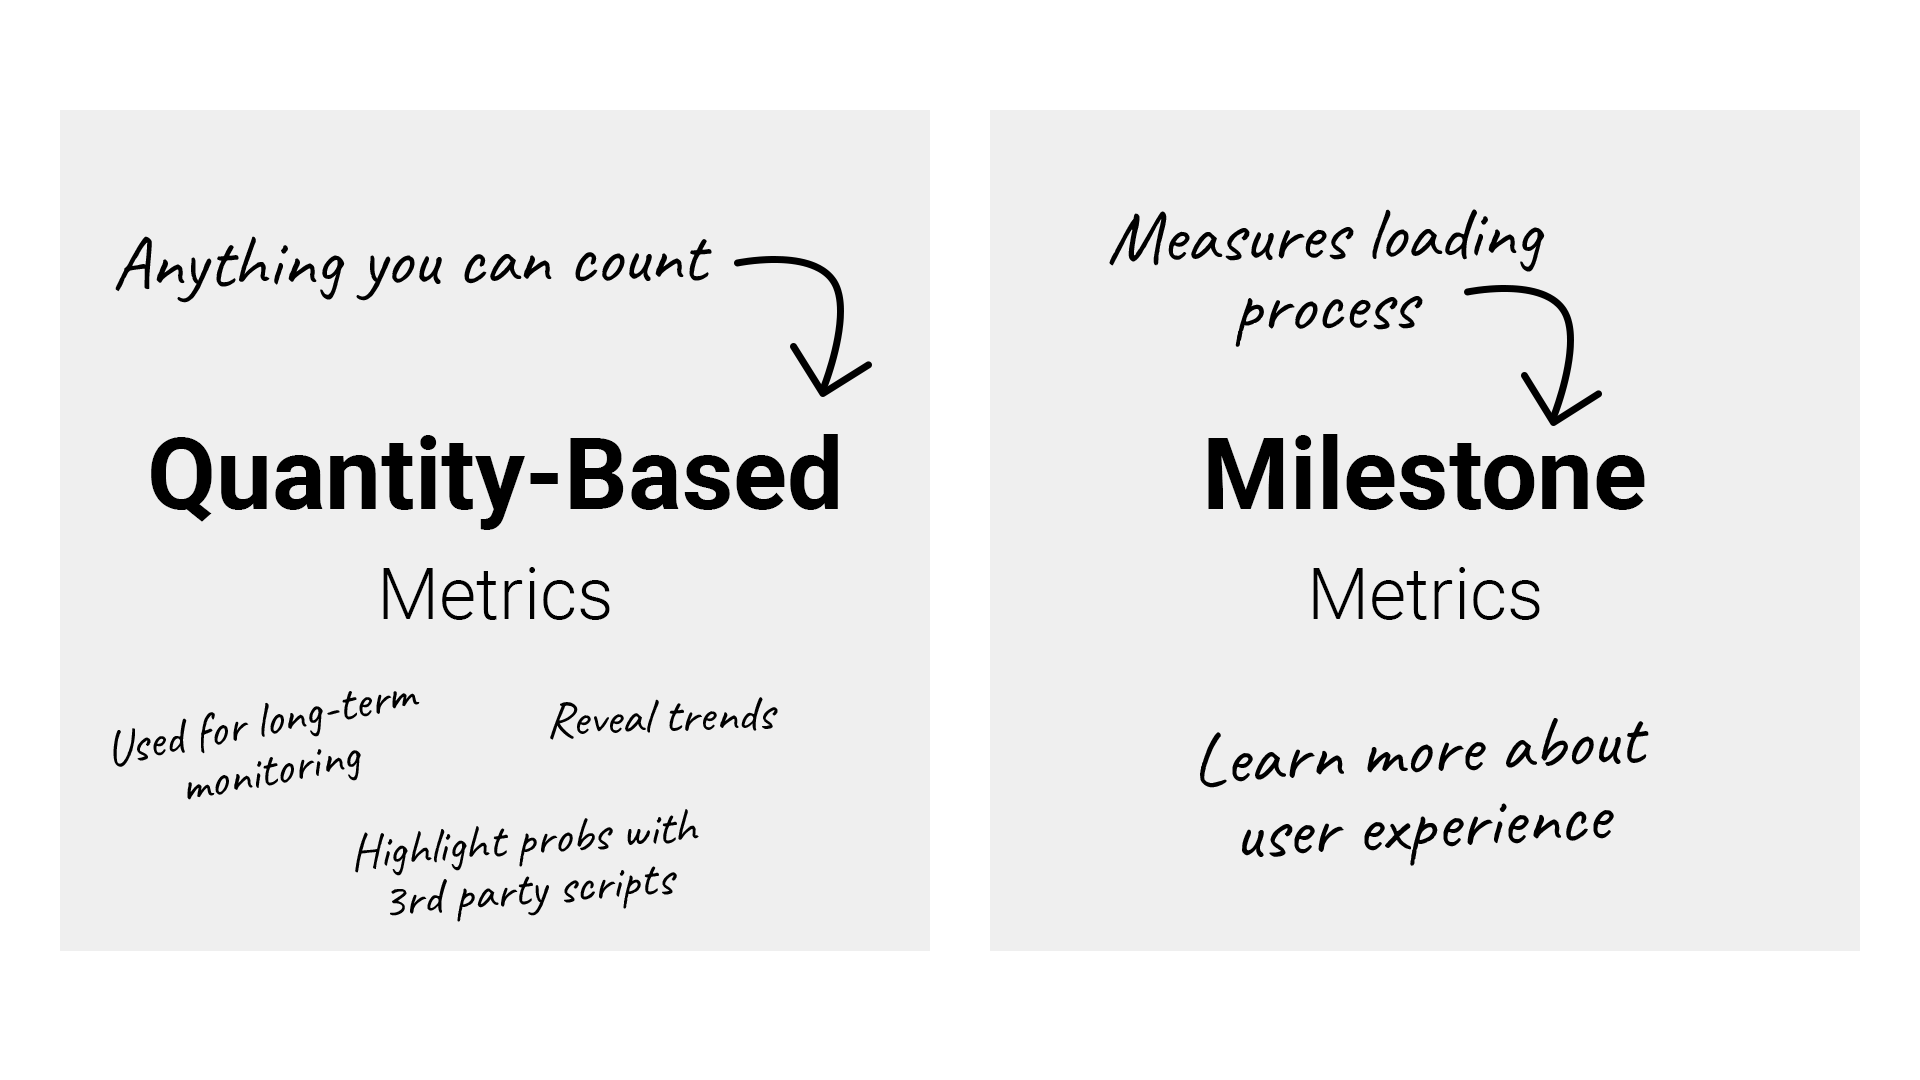
When measuring web performance, there are many different types of metrics which we can track. These all generally fall within the following categories.
Quantity-based metrics
Quantity-based metrics measure things such as the number of HTTP requests, the size of the page in bytes, the number of images loaded… basically anything you can count.
These are useful to monitor over time as the website grows and develops, as they can reveal trends, or highlight problems with 3rd party scripts for example.
Milestone metrics
Milestone metrics measure how long it takes the browser to reach a specific phase of the loading process.
For instance, how long the server takes to respond, how long it takes the browser to start rendering content, or how long it takes for that content to become interactive once JavaScript execution has completed.
These kinds of metrics allow us to learn more about the overall user experience.
Whilst quantity-based metrics are relatively self explanatory, milestone metrics require a little more elaboration.

Let’s go through some of the more common of these, in order of which they occur in a typical page load:
Web performance metrics
Time to first byte
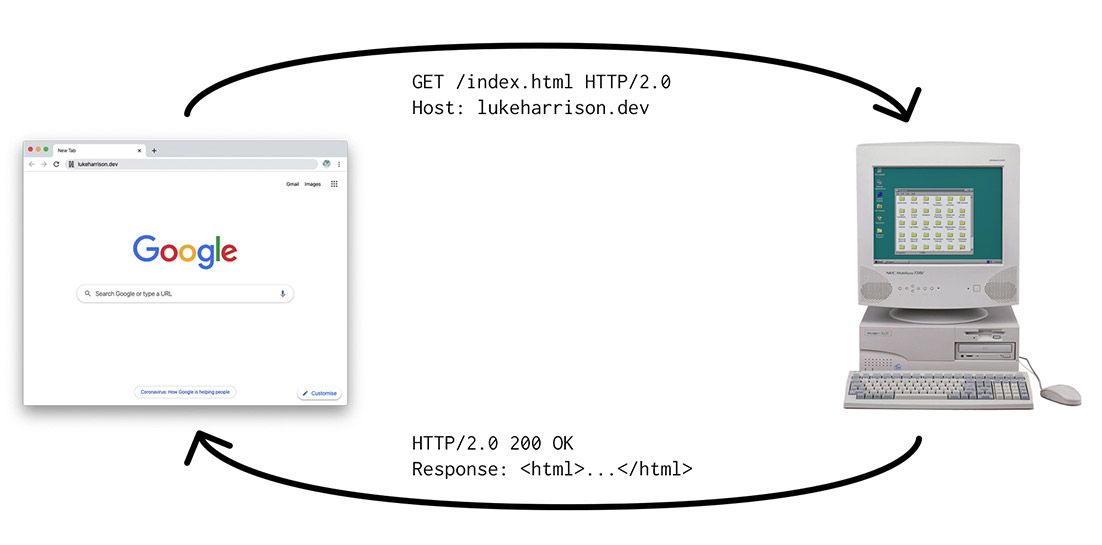
Time to first byte, or TTFB as it is commonly abbreviated as, is used to measure the responsiveness of a web server. More specifically, how long it takes the server to respond to the browser’s first request - the HTML - once a connection with the browser is first established.

Bad server config or back-end coding can be responsible for any poor performance in this area. Also, the further you are from the website’s server geographically, the longer it takes to respond.

Loading the same website from a server in the same city compared to the other side of the world is going to yield 2 very different time to first byte measurements.

First paint
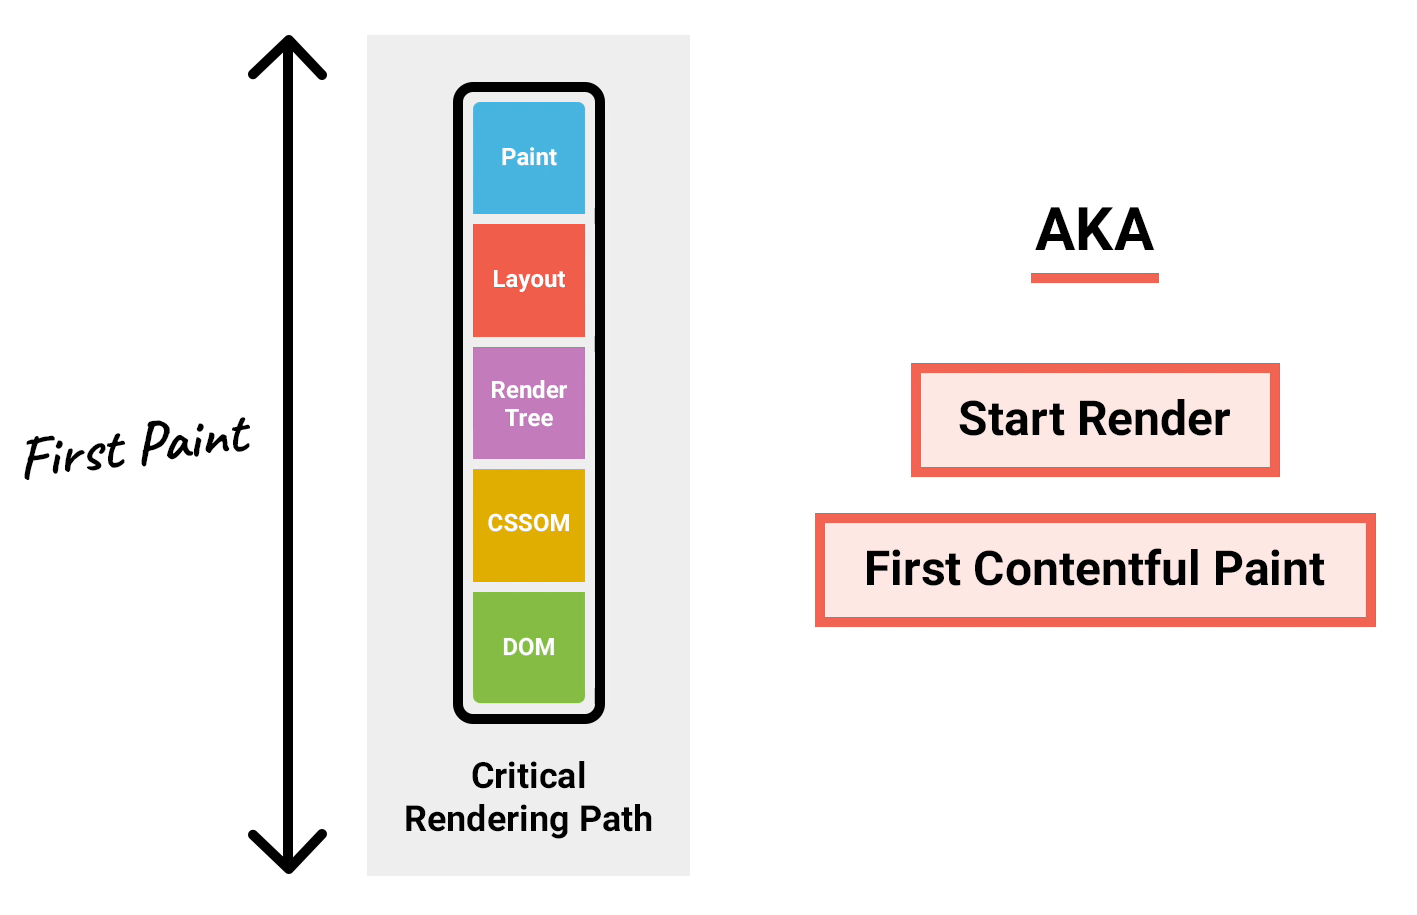
Once the browser has received the pages’ HTML, it’s able to begin the critical rendering path.
First, the DOM and CSSOM are generated - which together - form the render tree.
Next, the browser calculates the layout and then paints the website to the screen.
First Paint - sometimes also known as start render or first contentful paint - measures how long all of this takes to complete.

It’s essentially a measurement of how long it takes between when the user types in the web address and presses enter - to when bits of the website’s content - however small - first begin to appear in the browser window.
If this metric isn’t optimised, the user will likely think the website isn’t loading, as the browser isn’t providing any visual feedback fast enough to suggest anything is happening.
We can see a comparison of first paints in the video below. Here, you can see that Game has an acceptable first-paint, whilst TalkTalk… not so much!
First Meaningful Paint
Whilst the previous metric measures when *any* content is rendered, first meaningful paint only measures when *useful* content is rendered.
This is done by tracking when the largest <H1> node or image element is rendered in the viewport, as statistically these are very likely to contain important content.
Think of this metric as recording how long it takes the browser to load something recognizable and expected, as these are important milestones in the user’s perception of the website’s loading performance.
For example:
The power of perceived performance. Amazon is objectively the slower website by about 8 seconds, but numbers don't matter when there's a perception of speed. pic.twitter.com/mCet7J3Gnv
— Luke Harrison (@WebDevLuke) January 15, 2020
Speed Index
In the past, it has been common to track a website’s speed by measuring when the browser fires events such as DOMContentLoaded and Load.
These metrics, whilst legit measurements, aren’t a very good indicator of the actual end-user experience.
Why? If the browser’s visible content in the viewport renders after only a second, and then 5 more seconds are spent loading content hidden below the fold, 6 seconds is the value which will be passed back in the report, even though the user was able to meaningful interact with the website after only 1.
Speed index tries to fix this inaccuracy by measuring the average time it takes for only the viewport content to be rendered, with any below the fold elements now safely ignored.

This also means that when comparing page loads between mobile and desktop devices, the mobile devices will always have a lower speed index simply because there’s less viewport content to render.

Time to Interactive / Time to First CPU Idle
'Time to Interactive' measures the point in the loading process where the page is fully interactive and responding consistently to user input.
In addition, there is a newer metric called 'Time to First CPU Idle' (sometimes called First interactive) which measures when the page is first expected to be interactive in some capacity and responding to user input quickly.
So to reiterate this:
Time to interactive = Measures when the page is fully interactive.
Time to First CPU idle = Measures when the page is first interactive.
Making sure a page becomes interactive as soon as possible is paramount to achieving a positive user experience, as if elements don’t respond when the user tries to interact with the webpage, it’s highly likely that they’ll just get frustrated and go elsewhere.
Summary
Learning how fast a website loads isn’t just a matter of capturing its overall load time metric. Often, the user’s perception of a website’s load time is more important, and as such, requires us to capture a more diverse selection of web performance metrics.
By collecting a wider collection of different metrics, you gain a more accurate insight into the realities of your user’s experiences.
If you'd like to take your web performance to the next level, check out our range of powerful cloud servers.